Best viewed at http://vinja.tv/RLmVpVxc.
01. Andre M. Boisvert, Actian, Visits theCUBE!. (00:32)
02. Comparing Today's Innovation Cycle To Past Ones. (01:28)
03. What Does It Take To Be A Leader In Tech Today?. (06:18)
04. Andre Boisvert's Thoughts On Marc Benioff. (08:24)
05. Andre Boisver's Thoughts On Workday. (10:15)
06. Consumerization Trends - Andre Boisvert's Take. (12:32)
07. New Investment Strategies In Open Source?. (14:01)
08. What Lead Andre Boisvert To Actian?. (18:20)
09. The Chief Data Officer - Who Is It?. (21:16)
10. Who Should The Chief Data Officer Report To?. (22:42)
11. What Is Andre Boisvert Working On Today?. (25:07)
Track List created with http://www.vinjavideo.com.
--- ---
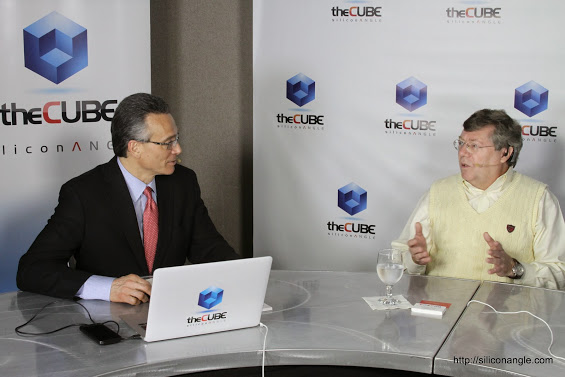
Andre M. Bosivert, Actian, at BigDataSV 2014 with John Furrier and Dave Vellante
@thecube
#BigDataSV
Andre M. Bosivert recently spoke in theCUBE with Dave Vellante and John Furrier about innovations springing up in the Big Data circuit and industry. Much of the discussion centered around the culture, technology, and leadership as seen surrounding big data on a high level, but there’s a lot of spaces that this innovation has affected DevOps as well.
Bosivert used to write microcode for IBM and watched a shift from IBM being a walk-in-service for computation where the enterprise housed computers and processed data and computers took the analysis back with them to a computer and software delivery company that brought data automation to customers. He describes this as the beginning of the beginning of the data processing industry.
“We learned very quickly that there’s a lot of value to be extracted from within your own silo—inside your own enterprise systems,” he says and this is about when he eventually moved onto predictive analytics. Customers will pay a great deal more money for an ugly report that predicts what will change tomorrow than for a pretty, gussied-up report of how much they lost yesterday.
This is very similar to current innovations and how DevOps impacts infrastructure development and maintenance. The explosion of the cloud is going back to a sort of model to “passing data to IBM and bringing the analysis back home” except that while it offloads some of the analysis to a datacenter in another state, virtualization still makes it act as if the computers are in the same building with the workers.
Predictive analysis and big data has two angles that affect DevOps directly: the tools that developers need to apply big data and how DevOps teams themselves can use big data to enhance reliability and stability. Much of this comes right out of the open source community, as discussed by Boisvert in his interview.
The DevOps Angle
Coming out of 2013, R is a favorite programming language for developers building tools for Big Data and analytics. This has led to many different Big Data tools to start getting integrations with R, such as Hadoop which saw a late 2013 tool updated to make R development possible.
We’ve also seen a number of tools arise that help abstract away or virtualize databases styled for the use of Big Data such as a tool from Pentaho, which includes an adaptive big data layer. And a tool from Orchestrate that gives DevOps operations teams a tool to abstract away connections to multiple NoSQL databases by virtualizing the data layer through a single API.
However, DevOps teams aren’t just developing for and into Hadoop and NoSQL—they’re also using these systems alongside tools for operational support of releases. In this era, continuous delivery leads IT teams to need to continually watch and review deployed apps. Logging software, in-borne call-home elements of apps (both mobile and on system) produce a great deal of data about how users act with their applications and even highlight both fatal and indirect bugs. All of this must be stored (ending up with Big Data storage) but also it needs to be analyzed.
An entire ecosystem of in-field testing of data coming from customers has been building in the industry for runtime in-stream analysis of data coming back from apps in the field. Including predictive analysis models that take advantage of context from historical analysis could be the difference between a bottleneck causing downtime and a DevOps team seeing the “aura” of the bottleneck before it starts to affect users.
Forgot Password
Almost there!
We just sent you a verification email. Please verify your account to gain access to
BigData SV 2014 | Santa Clara. If you don’t think you received an email check your
spam folder.
In order to sign in, enter the email address you used to registered for the event. Once completed, you will receive an email with a verification link. Open this link to automatically sign into the site.
Register For BigData SV 2014 | Santa Clara
Please fill out the information below. You will recieve an email with a verification link confirming your registration. Click the link to automatically sign into the site.
You’re almost there!
We just sent you a verification email. Please click the verification button in the email. Once your email address is verified, you will have full access to all event content for BigData SV 2014 | Santa Clara.
I want my badge and interests to be visible to all attendees.
Checking this box will display your presense on the attendees list, view your profile and allow other attendees to contact you via 1-1 chat. Read the Privacy Policy. At any time, you can choose to disable this preference.
Select your Interests!
add
Upload your photo
Uploading..
OR
Connect via Twitter
Connect via Linkedin
EDIT PASSWORD
Share
Forgot Password
Almost there!
We just sent you a verification email. Please verify your account to gain access to
BigData SV 2014 | Santa Clara. If you don’t think you received an email check your
spam folder.
In order to sign in, enter the email address you used to registered for the event. Once completed, you will receive an email with a verification link. Open this link to automatically sign into the site.
Sign in to gain access to BigData SV 2014 | Santa Clara
Please sign in with LinkedIn to continue to BigData SV 2014 | Santa Clara. Signing in with LinkedIn ensures a professional environment.
Are you sure you want to remove access rights for this user?
Details
Manage Access
email address
Community Invitation
Andre M. Bosivert - BigDataSV 2014 - theCUBE
Best viewed at http://vinja.tv/RLmVpVxc.
01. Andre M. Boisvert, Actian, Visits theCUBE!. (00:32)
02. Comparing Today's Innovation Cycle To Past Ones. (01:28)
03. What Does It Take To Be A Leader In Tech Today?. (06:18)
04. Andre Boisvert's Thoughts On Marc Benioff. (08:24)
05. Andre Boisver's Thoughts On Workday. (10:15)
06. Consumerization Trends - Andre Boisvert's Take. (12:32)
07. New Investment Strategies In Open Source?. (14:01)
08. What Lead Andre Boisvert To Actian?. (18:20)
09. The Chief Data Officer - Who Is It?. (21:16)
10. Who Should The Chief Data Officer Report To?. (22:42)
11. What Is Andre Boisvert Working On Today?. (25:07)
Track List created with http://www.vinjavideo.com.
--- ---
Andre M. Bosivert, Actian, at BigDataSV 2014 with John Furrier and Dave Vellante
@thecube
#BigDataSV
Andre M. Bosivert recently spoke in theCUBE with Dave Vellante and John Furrier about innovations springing up in the Big Data circuit and industry. Much of the discussion centered around the culture, technology, and leadership as seen surrounding big data on a high level, but there’s a lot of spaces that this innovation has affected DevOps as well.
Bosivert used to write microcode for IBM and watched a shift from IBM being a walk-in-service for computation where the enterprise housed computers and processed data and computers took the analysis back with them to a computer and software delivery company that brought data automation to customers. He describes this as the beginning of the beginning of the data processing industry.
“We learned very quickly that there’s a lot of value to be extracted from within your own silo—inside your own enterprise systems,” he says and this is about when he eventually moved onto predictive analytics. Customers will pay a great deal more money for an ugly report that predicts what will change tomorrow than for a pretty, gussied-up report of how much they lost yesterday.
This is very similar to current innovations and how DevOps impacts infrastructure development and maintenance. The explosion of the cloud is going back to a sort of model to “passing data to IBM and bringing the analysis back home” except that while it offloads some of the analysis to a datacenter in another state, virtualization still makes it act as if the computers are in the same building with the workers.
Predictive analysis and big data has two angles that affect DevOps directly: the tools that developers need to apply big data and how DevOps teams themselves can use big data to enhance reliability and stability. Much of this comes right out of the open source community, as discussed by Boisvert in his interview.
The DevOps Angle
Coming out of 2013, R is a favorite programming language for developers building tools for Big Data and analytics. This has led to many different Big Data tools to start getting integrations with R, such as Hadoop which saw a late 2013 tool updated to make R development possible.
We’ve also seen a number of tools arise that help abstract away or virtualize databases styled for the use of Big Data such as a tool from Pentaho, which includes an adaptive big data layer. And a tool from Orchestrate that gives DevOps operations teams a tool to abstract away connections to multiple NoSQL databases by virtualizing the data layer through a single API.
However, DevOps teams aren’t just developing for and into Hadoop and NoSQL—they’re also using these systems alongside tools for operational support of releases. In this era, continuous delivery leads IT teams to need to continually watch and review deployed apps. Logging software, in-borne call-home elements of apps (both mobile and on system) produce a great deal of data about how users act with their applications and even highlight both fatal and indirect bugs. All of this must be stored (ending up with Big Data storage) but also it needs to be analyzed.
An entire ecosystem of in-field testing of data coming from customers has been building in the industry for runtime in-stream analysis of data coming back from apps in the field. Including predictive analysis models that take advantage of context from historical analysis could be the difference between a bottleneck causing downtime and a DevOps team seeing the “aura” of the bottleneck before it starts to affect users.