Pharmaceutical counterfeiting hides in complex supply chains, but graph technology can expose the connections. At Neo4j GraphTalk, theCUBE Research’s John Furrier speaks with Thomas Luu, director of global product security at Gilead Sciences, about combining graph databases and AI to identify fraud patterns that conventional relational tools often overlook alone.
Luu explains how graph neural networks, knowledge graphs and OSINT reveal suspicious clusters, add context and reduce false positives. Furrier and Luu also discuss turning those insights into real-time decisions through cross-functional teams, analytics and AI agents, giving security, compliance and data leaders a clearer path to scalable fraud detection.
Forgot Password
Almost there!
We just sent you a verification email. Please verify your account to gain access to
theCUBE + NYSE Wired: Data + AI: Turning Data Into Knowledge for Autonomous Systems. If you don’t think you received an email check your
spam folder.
Sign in to theCUBE + NYSE Wired: Data + AI: Turning Data Into Knowledge for Autonomous Systems.
In order to sign in, enter the email address you used to registered for the event. Once completed, you will receive an email with a verification link. Open the link to automatically sign into the site.
Register for theCUBE + NYSE Wired: Data + AI: Turning Data Into Knowledge for Autonomous Systems
Please fill out the information below. You will receive an email with a verification link confirming your registration. Click the link to automatically sign into the site.
You’re almost there!
We just sent you a verification email. Please click the verification button in the email. Once your email address is verified, you will have full access to all event content for theCUBE + NYSE Wired: Data + AI: Turning Data Into Knowledge for Autonomous Systems.
Thanks for confirming your account. Now you can access theCUBE + NYSE Wired: Data + AI: Turning Data Into Knowledge for Autonomous Systems with this email address.
I want my badge and interests to be visible to all attendees.
Checking this box will display your presense on the attendees list, view your profile and allow other attendees to contact you via 1-1 chat. Read the Privacy Policy. At any time, you can choose to disable this preference.
Select your Interests!
add
Upload your photo
Uploading..
OR
Connect via Twitter
Connect via Linkedin
EDIT PASSWORD
Share
Forgot Password
Almost there!
We just sent you a verification email. Please verify your account to gain access to
theCUBE + NYSE Wired: Data + AI: Turning Data Into Knowledge for Autonomous Systems. If you don’t think you received an email check your
spam folder.
Sign in to theCUBE + NYSE Wired: Data + AI: Turning Data Into Knowledge for Autonomous Systems.
In order to sign in, enter the email address you used to registered for the event. Once completed, you will receive an email with a verification link. Open the link to automatically sign into the site.
Sign in to gain access to theCUBE + NYSE Wired: Data + AI: Turning Data Into Knowledge for Autonomous Systems
Please sign in with LinkedIn to continue to theCUBE + NYSE Wired: Data + AI: Turning Data Into Knowledge for Autonomous Systems. Signing in with LinkedIn ensures a professional environment.
Are you sure you want to remove access rights for this user?
Details
Manage Access
email address
Community Invitation
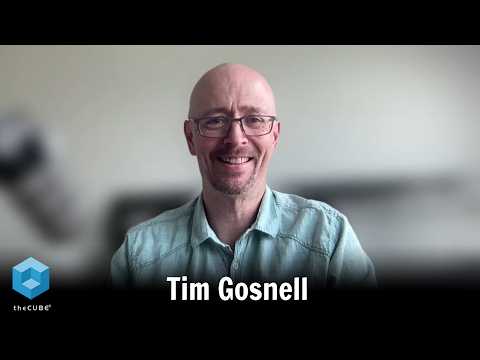
Thomas Luu, Gilead | Neo4j GraphTalk 2026
Thomas Luu of Gilead Sciences, director of global product security, leads anti-counterfeiting and trust efforts across pharmaceutical products. At Neo4j GraphTalk in San Francisco, John Furrier of theCUBE Research hosts a conversation on applying graph databases and artificial intelligence, referred to as AI below, to pharmaceutical fraud detection across global supply chains.
Luu discusses converting relational data into graph representations and leveraging graph neural networks and knowledge graphs to detect fraud, waste and abuse across disparate data sources. They explain how graph models surface hidden networks and clusters that traditional relational analysis misses, improving explainability and investigator efficiency. They emphasize contextualizing signals with open source intelligence, referred to as OSINT below, and business knowledge to reduce false positives and to scale detection. The conversation highlights the need to operationalize graph platforms with cross-functional teams, analytics and AI agents for real-time explainable decisioning.
This discussion provides practical insights for security, analytics and compliance professionals working on pharmaceutical supply chain integrity, data governance and fraud detection.
Pharmaceutical counterfeiting hides in complex supply chains, but graph technology can expose the connections. At Neo4j GraphTalk, theCUBE Research’s John Furrier speaks with Thomas Luu, director of global product security at Gilead Sciences, about combining graph databases and AI to identify fraud patterns that conventional relational tools often overlook alone.
Luu explains how graph neural networks, knowledge graphs and OSINT reveal suspicious clusters, add context and reduce false positives. Furrier and Luu also discuss turning those insights into ...Read more
exploreKeep Exploring
What kinds of abuses are encountered when investigating counterfeiting and fraud in the pharmaceutical industry (e.g., copay and patient‑assistance program fraud, counterfeit drugs, fraudulent chargebacks)?add
Why move from relational data to graph data and adopt graph neural networks (with Neo4j) for fraud detection?add
How has implementing graph neural networks with Neo4j affected data wrangling, preparation, and pipelining, and what outcomes or benefits have been revealed by using graph-based approaches?add
How do graph/knowledge-graph methods make it easier and more efficient to analyze disparate datasets, reveal hidden relationships (e.g., fraud rings), and provide explainability/traceability for non-data investigators compared with manual relational-data analysis?add
What business outcomes and benefits have resulted from adopting graph/knowledge-graph technology, and how was it rolled out/implemented?add
>> Welcome back to theCUBE here in San Francisco. I'm John Furrier, host of theCUBE. We are the Neo4j GraphTalk in San Francisco. Of course, in New York City in September, I'll be there as well, as practitioners gather to talk about the future of how data plays in the AI world, graph databases, ontologies, and the use cases of how AI stack is fiddling in with the data. Huge piece of it becoming very, very popular in production workloads. Thomas Luu here is Director of Global Product Security at Gilead is here. Thanks for coming on. Thomas, appreciate it.
Thomas Luu
>> Yeah, thank you so much for having me.
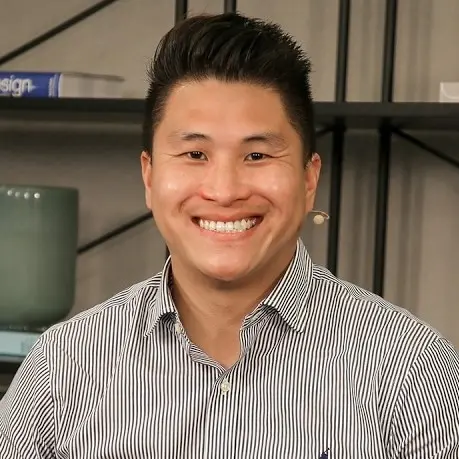
John Furrier
>> We were talking off camera that you guys were the first industry player to adopt graphs in a way using AI. Congratulations. First mover usually has blood on their hands, eating glass, spitting out nails. You've been successful. Talk about the use case and what you're working on there and talk about the company a little bit if you want to set the table, but very compelling approach.
Thomas Luu
>> Yep. Okay, so as you mentioned, I'm with the Global Product Security. We're a function of Legal at Gilead Sciences. We're a pharmaceutical manufacturer of HIV and HCV drugs. I'm on the Anti-Counterfeiting and Trust team, and what we do is we look for fraud, waste and abuse across all of the different commercial business that we have. And because of the nature of our work is very nuanced, we had to approach things in a very unique way that enabled us to be successful.
John Furrier
>> What kind of abuses do you see? I mean, I'm just curious because I know that's a whole underbelly in most industries, but drugs and Medicare, Medicaid is a lot. I mean, I was seeing on the news, "Oh, they're sending benefits to dead people." All kinds of weird things are now being discovered because you turn the lights on, which graphs kind of illuminate, what are some of the things that were popping out that's been going on?
Thomas Luu
>> So we hunt for counterfeits globally. Counterfeits appear all over the world and that shows up in the data in very nuanced places. We also hunt for fraud, waste, and abuse. One of the things that enables fraud is our product is very expensive, and we offer a lot of patient support, and whenever there is free stuff being given out, there's going to be somebody to take advantage of it. So when we have fraudulent claims for copay fraud or patient assistance program fraud, or we have fraudulent chargebacks and things like that, that's the kind of stuff that we got to go into the data to surface and investigate.
John Furrier
>> Yeah. Regulated industries used to be kind of like, "Oh man, the data is such a huge challenge." You got compliance and governance. But if you look at the AI era, all that data prep was done on purpose by accident for AI because all that sets the table.
Thomas Luu
>> Yes.
John Furrier
>> You got structure, and there's also a lot of unstructured data coming in real time so you've got a massive data estate.
Thomas Luu
>> Yes.
John Furrier
>> In kind of a way, you got there in the right way.
Thomas Luu
>> Yeah.
John Furrier
>> Not for the right reason, but you're in a good spot. Explain that use case because you have to look at a lot of data.
Thomas Luu
>> Yes.
John Furrier
>> And then where does the graphs fit in? Because I think it's a great example of innovation of what is a mature, robust data industry that has huge opportunity. We're seeing healthcare, bio, pharma, chemists, all these areas are popping with AI. AI is bringing massive change and value.
Thomas Luu
>> Yep. So as far as data's concerned, one of the things that you'll hear commonly across any data analysts and data scientists is that garbage in, garbage out. And with our business, we have a lot of different data channels that are very complex and nuanced. And each data set has its own thing that you got to deal with and there's numerous nuances that you have to understand. So off the bat, we knew that for us to even just do manual analysis on it, we need to get the data to a point where we can actually analyze it and trust that the data is accurate and clean. But that also sets the stage for putting into automated systems like AI and machine learning, so when we had our data all cleaned up and in one place to accelerate our efforts, because there's always a human limitation on how much you can do, we started applying machine learning and AI to help accelerate some of the more tedious tasks that is involved with data.
Thomas Luu
>> And because we set that stage, we were able to very readily convert the relational data into graph data, which allowed us to take advantage of graph neural networks and graph machine learning, which opened up a whole new world for us. Because in our world, fraud doesn't really happen transaction by transaction. It happens across entities, across groups, across networks, and that was one of the primary drivers for us considering going into the graph world because fraud doesn't happen with just one transaction, it happens across a lot of entities, and a lot of these entities are hidden. Because when I first started hunting for fraud, the outliers are easy to find, right?
Thomas Luu
>> You just look for the one that's different from everything else on a very simplistic sense. But I always said the best fraudsters are the ones that's hiding in the averages, and they're hiding amongst peers and they're concealing their activity. And with the implementation of graph neural networks with Neo4j, we were able to really surface these hidden networks and enable us to analyze our data to a level and to a scale that was not possible before because of human limitations. And that's how we got lucky that AI and graphs, the graph world evolved to the point where we were ready to intake it, and that was really a big factor.
John Furrier
>> It's a really good point. I want to just get your thoughts because this seems to be the trend. The compatibility on the computer science side matches beautifully with AI on graphs. I mean neural networks, you said.
Thomas Luu
>> Yeah.
John Furrier
>> I mean, the way we think and work are not lists and tables. We work in our brain, and that's essentially a graph in my opinion. So when you look at that, that enables opportunity. What are some of the things that's changed for you in either the toil and the undifferentiated heavy lifting of the data wrangling and prep and pipelining? And what are some of the outcomes or benefits that were revealed with the graph?
Thomas Luu
>> So when we went into graph, a lot of the stuff that I would be doing manually, like comparing relational data to each other, my background allowed me to do that, and my particular intersection of skills and experience allowed me to be able to analyze that effectively. But when we were trying to have other people do it, it was a lot more difficult because you really do have to be in the data to understand it. And investigators weren't necessarily data people, right? So I just looked for ways to make my day easier, and that was one of it. When we're able to do multi-data set analysis and reveal the hidden connections within it, it allows me to be more efficient at what I do. And it also allows me to share the landscape with others in a more easy to understand way because by the nature of graph, it's very intuitive how data points or nodes are related to each other, and that has enabled me to explain complex schemes or scenarios.
John Furrier
>> Because you laid out the relationships.
Thomas Luu
>> Yes.
John Furrier
>> You looked at all the different disparate data sets you were looking at and they all have different nuances as you pointed out, which means they're complicated.
Thomas Luu
>> Yeah.
John Furrier
>> And so okay, you get them in a graph on a relationship map, you can just roll that up. Are you writing the scripting language does that or just gives you more of the explainability? What's the-
Thomas Luu
>> It gives us not only more explainability, but also, it allows us to uncover clusters where we have a main player and then auxiliary players that... Let's say their signals in the data aren't strong because they're very low volume. There would be a much more hidden to a human eye than in the graph. The graph relationship, it tells you exactly what it is. It's very intuitive when you look at a relationship graph or a knowledge graph, how different aspects it is.
John Furrier
>> It does the clustering for you basically-
Thomas Luu
>> Yes.
John Furrier
>> ... because what the graph does, it says, okay, put all the people that are related to this transaction.
Thomas Luu
>> Yes, exactly.
John Furrier
>> There's the fraudsters and that branch right there, so you have a branch graph of the fraudsters.
Thomas Luu
>> That's exactly what we do.
John Furrier
>> Yeah, so that's a self-propagating mechanism.
Thomas Luu
>> Yes.
John Furrier
>> And the work to do that alternatively without graphs is what? Grind through data dumps?
Thomas Luu
>> Yeah, exactly. I've done all that. That's why I was looking for an easier pathway, just to increase efficiency. And also, so I can share the knowledge and the outcomes with people that don't necessarily have the same skills.
John Furrier
>> We heard this as, this is a theme that's popping out on the graph talk 100% of the time, which is justification to non-graph people, whether it's in security or in any job. It's like, okay, I made these decisions because of.
Thomas Luu
>> Yep.
John Furrier
>> You got the lineage, you got the explainability, you got the traceability.
Thomas Luu
>> And even just something like querying data because it's already embedded in the node, so you don't really have to look another place for it. With a glance, you could see the volume, the depth of the relationship, and their whole network basically, and that has skipped a lot of steps in having to really verify things before we have a good idea of what's going on. We can, at a glance, understand relationships, volumes, relative trends. And it allows us to triage more effectively. It allows us to understand who the main players are, who are the auxiliary players, and also who to watch out for because they're adjacent to this network. They might not be doing anything today, but we've seen over time-
John Furrier
>> I mean, you built a little surveillance network.
Thomas Luu
>> That's exactly what it is. We serve the whole landscape to ultimately protect our patients and make sure that the resources go to the right places to benefit the right people.
John Furrier
>> What are some of the outcomes? How does this translate into business benefits? Explain how this rolled out because again, another consistent theme in the graph community that I'm seeing is that there's a lot of massively cool discovery, like what we were just talking about. I've heard many examples of, no one really knows what I work on, but I see all the value. Then when I talk to people about it, they think they have three heads so they don't understand. So I just surprise them with outcomes. So you're seeing graph working on the hardest problems in a lot of these companies. And certainly, Palantir has made ontology a mainstream word, but it's been around for many, many years.
Thomas Luu
>> Yes.
John Furrier
>> I remember in the '80s they were out, but now you have the timing of the AI compute, the data structure, you have the data tsunami so that's everyone's been flooded by tons of data. Old data, existing data, new data's coming in. So that seems to be a perfect storm. What are some of the things that you've thrown out over the transom to the team saying?
Thomas Luu
>> Some of the benefits that we've immediately derived out of it was one is we're able to immediately access data for insights. So instead of having to query data and getting numbers, the numbers are embedded in there. Also, the level of effort in doing the manual analysis with graph machine learning, we're able to do that much more effectively and across data sets because previously, our AI machine learning detection models, they function best with a single data set at a time. But with graph, we're not limited by that anymore, and the big thing that really future proofs this is that with graph, you can build upon it iteratively and not have to rewrite any of the previous work. And that was a key thing to us because like you said, we do encounter new data sets either through litigation or other means. With the old way, we'd have to figure out some stuff to understand the relationship.
John Furrier
>> Yeah, schema work.
Thomas Luu
>> Yeah, exactly.
John Furrier
>> Database work.
Thomas Luu
>> With graph, we could just add to that knowledge graph.
John Furrier
>> As a weekend right there, kill.
Thomas Luu
>> Yep.
John Furrier
>> Time savings. Talk about the machine learning piece, because fraud detection has been a really big market for traditional machine learning.
Thomas Luu
>> Yep.
John Furrier
>> Unsupervised, unsupervised. Now with AI, you're seeing people trying to shortcut that. What are people that try to bolt on AI that don't take this approach? What are some of the missteps that can cause it to either have built in technical debt, or just not built for success?
Thomas Luu
>> So part of the training that we do and that we're very rigorous on is to manage false positives, right? Because the machine learning, it'll interpret mathematical signals and give you an outcome based on what you program. But in the real world, in a business sense, a signal is just a signal until you determine it to be fraud. Because some of the signals that we look at is like if a pharmacy, for instance, regularly purchases a hundred bottles a month, and then all of a sudden they drop to 50 bottles and then that would indicate something to us, right?
John Furrier
>> Yeah.
Thomas Luu
>> But that doesn't necessarily mean fraud or anything. But then if we look at another data set where they're doing something like copay claims, right? Copay claims are generally over time very consistently proportional to the sales volume. And if we see that signal continue to increase, it shows that they're not buying from authorized distributors anymore so that's one signal that we look for that could indicate something.
John Furrier
>> So you guys could ground data that looks like a potential positive or false positive, look at it, mark it, and make that an origination point.
Thomas Luu
>> Yeah.
John Furrier
>> Then look downstream to see what happens.
Thomas Luu
>> Yes, and in another case, that same exact signal where you see that drop, it could have been just like that pharmacy is not focusing on this product any more so there's a lot of explainable reasons why we could see an increase or a decrease in some volume, and it's not always fraud. Sometimes it's explainable by certain things. Another example I like to use is that say a volume increased a lot. It could be that that pharmacist there is very passionate now about our HIV drug because somebody in their family was affected by it and now they're really advocating for HIV medication and PrEP and that's why the volume went up. Nothing nefarious going on there, it's just a change in the market that's legit. So those are some of the things where I think-
John Furrier
>> You can also put parameters around what is fraud.
Thomas Luu
>> Yes.
John Furrier
>> And look, put some context around.
Thomas Luu
>> Yes. The context is what's important because I think that the context is what makes our knowledge graph so valuable because when we're looking at data just straight up, we're just looking at numbers and making assumptions on what it is. But when we add our context, and one of the values of graph is that we're able to put in unstructured data, which for us would be OSINT data, right? And that gives a lot of context on what's going on in that particular situation. It allows us to triage way more effectively and understand what's really going on rather than just to blindly interpret signals. And I think that's one of the things that a lot of people struggle with. They just do what it says and they don't understand the-
John Furrier
>> Thomas, you're pretty pumped about graphs.
Thomas Luu
>> Yeah.
John Furrier
>> Sounds like.
Thomas Luu
>> Yes, yes.
John Furrier
>> And what's the future look like for you if you had to lay it out? How do you see this going next level? What would that look like for you?
Thomas Luu
>> Next level, we're hoping to get all of our major data sets into the graph and have a knowledge graph that encompasses our entire business. And then we're going to have a chatbot layer on top of it where you don't even need the technical skills. You don't have to understand Cypher to be able to generate a graph, you could just ask a natural language query and you'll get a very robust answer specific to what we do in particular, which is-
John Furrier
>> Are you guys looking at Cypher? I mean, Cypher gets a lot of great reviews, simple to use. Is there a translation layer with a chatbot?
Thomas Luu
>> Yes.
John Furrier
>> Cypher from my behalf, pre-fill.
Thomas Luu
>> Yeah. Before what we did was we would just use AI to write a Cypher and then enter it in. But now, our chatbot could just do that automatically and then query the graph and then return a result.
John Furrier
>> That's a game changer on the business side.
Thomas Luu
>> It is.
John Furrier
>> Now the sales teams can come in here, business management can come in, and essentially you just essentially created a digital twin of yourself, basically.
Thomas Luu
>> Yes. Yeah, I don't want to talk about-
John Furrier
>> Not an exact analogy, but kind of.
Thomas Luu
>> Yeah, I don't want to talk myself out of a job, but I always said that this could replace me because the infrastructure that we're building right now, because it has all of our data in it, we're using it to find fraud, waste and abuse. But I've always told our leadership that we could use it for marketing. We could use it for targeting prescribers. We could just understand the layout of the business and many use cases, but we use it for fraud, waste, and abuse.
John Furrier
>> Well, I wouldn't worry about putting yourself on a job because here's what the trend that I'm seeing. I've seen this pattern and it's emerging. So it's kind of primary data, but it's early. The winners that do this tend to shift the people who have the domain skills who set up the systems to be like, I'll put it in quotes, "gamers." If you look at a multiplayer gamer, it's like, okay, you got a lot going on. Things are popping, we're changing. So there's a lot as agentic kicks in, and more users, you're going to need a team of people to manage the data estate just to make sure that it's like an F1 car. Yeah, people will drive, but you have a whole team-
Thomas Luu
>> Yes, yeah, absolutely.
John Furrier
>> ... behind it with analytics. I think there's a whole nother level of discipline-
Thomas Luu
>> It is.
John Furrier
>> ... that's going to come out of this. To me, next level is F1 car. You got a driver who knows how to drive the machine. You come in, people swap the tires out. You got people who work on the car, people who design it, analytics. That's the way we see the modern business going, basically. You got to have the core brain. But once that's in place, who's driving? So everyone's going to have this dynamic, and no one really gets taken out. The grunt work goes away. The toil, the undifferentiated heavy lifting, okay, yeah, that's gone, but it goes to another skill level.
Thomas Luu
>> Yes, absolutely.
John Furrier
>> And they're like gamers and dashboards everywhere. It's real time priorities, explainability, pass, throw to AI agents. So managing fleets of agents and the future, it's very matrix-like.
Thomas Luu
>> It is. Yeah, the key to our success is the team. And what I found is the more people I talk to about graph, once they understand the concept of it and what it is, especially with the younger generation, they really gravitate towards it because you don't need that old school knowledge. You can see the relationships intuitively.
John Furrier
>> Tom, it's great stuff. I mean, there's two things I'm most excited about right now in the industry. It's graphs for the reason we're talking about them, but also, the AI factories in the edge of the network.
Thomas Luu
>> Yes.
John Furrier
>> As you start moving out to the edge, whether it's telecom or instrumentation, wearables, hospitals, any kind of industry, you're going to have end-to-end intelligence.
Thomas Luu
>> Absolutely.
John Furrier
>> And to me, those are the two areas I think have the hottest innovation right now.
Thomas Luu
>> I agree.
John Furrier
>> Thanks for coming on, appreciate it.
Thomas Luu
>> All right, thank you, sir.
John Furrier
>> I'm John Furrier with theCUBE here at the GraphTalk. Talking graphs, that's the topic here. Of course, how it relates to innovation as AI and people look at ontology as they think about that AI platform at the software estate level, the data layer, the harmonization layer, the semantic layer. It's going to look different and it's going to be more powerful. We're doing our part here in San Francisco. Thanks for watching.







 John Furrier